

One of the most important numbers in climate science is 3°C. This isn’t about a projection of future warming or the impacts that come with it, though. It’s about how much warming you get if you double the amount of greenhouse gases in the atmosphere. That value can be made more general as a metric known as “climate sensitivity,” which describes how much warming you get for a given amount of emissions. If the number is small, we can burn a lot of fossil fuels with minimal consequences. If the number is extremely high, emissions are extraordinarily dangerous.
This number is commonly defined against a doubling of the concentration of CO2 in the air, in part because CO2’s effect is logarithmic and each doubling is roughly equivalent. Calculations of this value go back to the turn of the 20th century, when the Swedish scientist Svante Arrhenius came up with numbers in the 4-6°C range. But a major milestone was reached in 1979, when a group of scientists released a climate report that included this value. The scientists wrote, “We estimate the most probable global warming for a doubling of CO2 to be near 3°C with a probable error of ±1.5°C.”
Despite all the scientific progress since then, that answer (1.5-4.5°C) has held up. The 2007 Intergovernmental Panel on Climate Change report tightened it up a bit to 2.0-4.5°C, but then a handful of studies released just before their 2013 report caused confusion that led to a return to the old 1.5-4.5°C range.
Shrinking that range has been a goal of climate scientists, though the problem has proved stubborn. In a notable step forward, a group of 25 climate scientists published a study this week that presents a new synthesis of the evidence. And they conclude that a narrower range is warranted.
Defining your terms
The general approach of the 25 scientists was to combine estimates from three different lines of evidence: the instrumental record going back to the 1800s, paleoclimate events, and research on the individual processes that make up Earth’s climate system. If any one line of evidence can rule out a number, then that can be excluded from the overall answer as well, potentially trimming the final range.
One quirk of this field of research is that climate sensitivity has to be defined in an incredibly specific way so that estimates are consistent. This inevitably leads to a splintering into several different definitions, mostly based on the timing of changes. Earth’s climate system has forcing factors that can drive temperature change—such as greenhouse gases or changes in sunlight—and feedbacks that either amplify or dampen those driving changes. These feedbacks range from nearly instantaneous to sluggish shifts over thousands of years, and you have to draw the line somewhere.
While longer-term sensitivity is also studied, the focus is generally on sensitivity over a century or two. This is called “equilibrium climate sensitivity,” and its history goes back to that landmark 1979 report. In this new study, the researchers are actually primarily working with a slightly more specific version of this—measured from a scenario where CO2 is instantly quadrupled and then temperature is determined after 150 years—but they convert the final answer to equilibrium climate sensitivity for properly apples-to-apples comparisons with the IPCC analysis and that 1979 report. In practice, the difference between these numbers is tiny, but hey, the details matter here.
Follow the evidence
The team started with the instrumental record, which reaches back in the 1800s. You might think this is fairly straightforward: we know how much CO2 increased, we know how much temperature increased, so do the math. But in practice, there are major complications. We haven’t only emitted greenhouse gases, for example, but also aerosol pollution that reflects sunlight for a cooling influence. In order to get the greenhouse effect right, you have to subtract the exact contribution of this cooling influence, which has been difficult to nail down.
There’s also the question of how much of the equilibrium warming has materialized at this point in time, which is complicated by the fact that even regional patterns of warming can affect your answer. Attempting to account for all this, they get a central sensitivity estimate of 3.8°C for doubled CO2, though the error bars are huge, with numbers as high as 18°C still being possible.
To work with the deeper past, the team focused on the cold peak of the last ice age around 20,000 years ago and a period of warming in the mid-Pliocene just over 3 million years ago. Both are well-studied and often used to understand how Earth’s climate changes in very different contexts. Because ice cores contain air samples from the last ice age, we know exactly how much lower CO2 was then. Calculating the global average temperature from the available local paleoclimate evidence is less easy, but the researchers put it at 4-6°C cooler than the 1800s.
Given that the mid-Pliocene is deeper in the past, both the temperature and the greenhouse gas concentrations estimates are less exact. They work with a scenario 2-4°C warmer than the recent past and the best estimates for combined greenhouse gases. One reason to work with a colder period and a warmer period is that Earth’s climate sensitivity actually changes a bit with its temperature, such that the ice age world was likely a bit less sensitive to CO2.
Combining estimates for each time period, they get a sensitivity range of 1.5-5°C. And again, that doesn’t sound much like progress against the old 1.5-4.5°C range.
But the last line of evidence is probably where scientific knowledge has increased the most in recent years. The researchers break down forcing factors like energy captured by increased CO2 and feedback factors like the complex behavior of clouds to work up to a total response for the climate system. Clouds, in particular, are hugely important. For example, high-altitude, wispy clouds act more like greenhouse gases than shade umbrellas, while low, fluffy clouds can reflect a lot of incoming sunlight back to space.
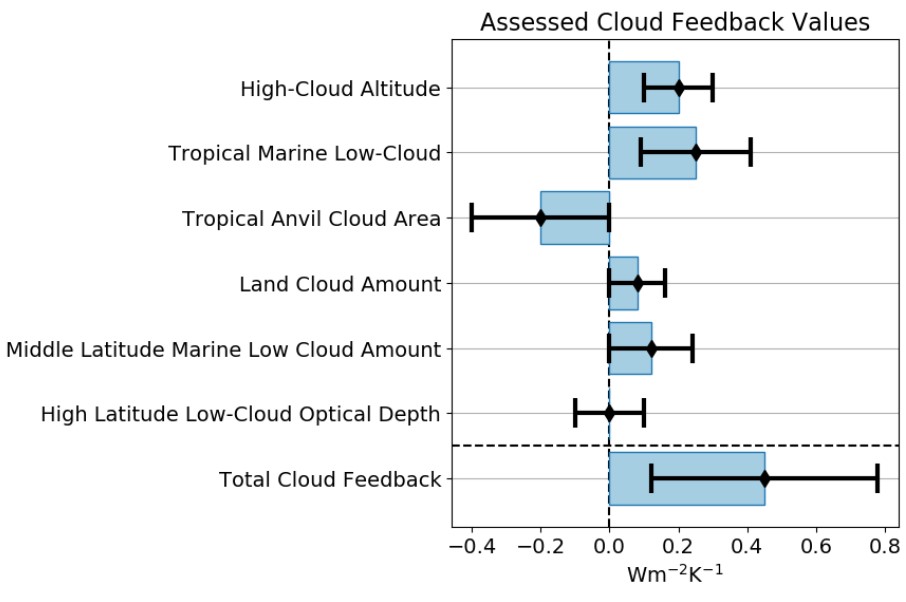
To give you a taste, these are estimates for the response of different types of clouds to climate change. A positive number represents something that would increase future warming.
A ton of careful science is packed into this category, summing up to an estimated sensitivity of 2.3-4.6°C for doubled CO2.
Play the synth
Carefully combining all these estimates yields the final range. Very low sensitivities are ruled out by cloud physics and by the understanding from the instrumental and paleo periods. Very high sensitivities would require the understanding of clouds to be wrong in the other direction, aerosols to have a much stronger cooling effect than we thought, and our understanding of paleoclimate changes to be off.
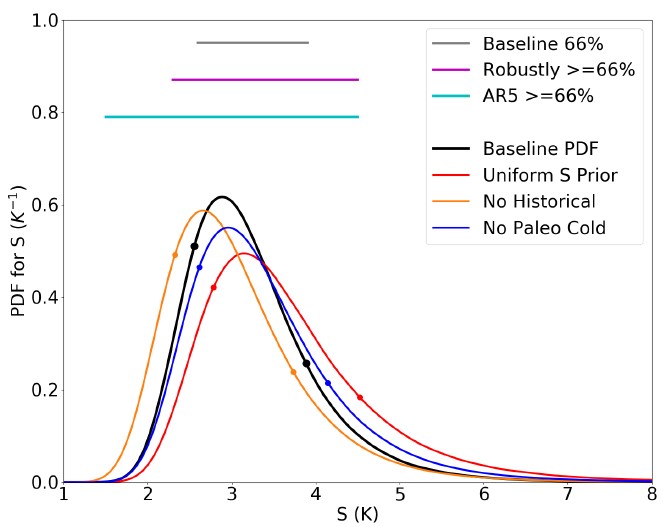
Final estimates of the sensitivity range in Kelvin (which is the same as °C). The black curve is the calculated estimate, while the colored curves represent alternative calculations, such as using only 2 of the 3 lines of evidence. The light blue “AR5” line represents the range given in the last IPCC report.
So the likely range for equilibrium climate sensitivity ends up at 2.6-4.1°C, with the most likely answer just a hair above 3°C. (Even some tests of alternate assumptions or methods stay within 2.3-4.5°C.) That’s considerably narrower than the old 1.5-4.5°C range.
Notably, this study does not use the sensitivity of climate models as a line of evidence, although climate models are certainly used to help break down aspects of the climate system. The latest generation of climate models has been making news for an unnerving increase in average climate sensitivity, with the upper end increasing from 4.7°C in the previous generation to 5.6°C. But this study provides a good reminder why climate scientists are skeptical that those more-sensitive models are realistic.
Overall, there are heaps of careful and nitpicky work in this synthesis effort (the manuscript weighs in at a svelte 166 pages), the product of a concerted community effort that began with a week-long workshop in 2015. The broadest takeaway is that our best understanding of how much warming our greenhouse gas emissions are causing seems quite likely to be accurate. A climate sensitivity below 2°C or around 4.5°C might cause us to reconsider our present attitude about climate change, moving the expected timeline of impacts forward or back. But this research suggests that neither of those outcomes is likely. Instead of worrying about adjusting our climate action targets, we can just worry about hitting the targets we’re already quite late to.
Reviews of Geophysics, 2020. DOI: 10.1029/2019RG000678 (About DOIs).

Musicaholic. Unapologetic alcohol maven. Social media expert. Award-winning coffee evangelist. Typical thinker.


